
In short
The PageSpeed score is a grade from 0 to 100 that Google calculates for a page from five loading measures. It is green from 90, orange from 50 to 89 and red below. Because it comes from a lab test, it moves a little from one run to the next. Google mostly recommends aiming for good Core Web Vitals, which are measured on real visitors. Ecograder completes the picture with page weight, emissions and hosting. My sites aim for 95 or more on mobile for the home page and 100 for the other pages, without chasing the last point at any price.
What is the PageSpeed score?
PageSpeed Insights is Google’s free tool for testing a page. Its report mixes two kinds of data, and people often confuse them. Field data comes from the Chrome User Experience Report: these are measurements from real visitors, pooled over a rolling 28 days. Lab data comes from Lighthouse: the page is loaded once, in a simulated environment. On mobile, the test imitates an entry-level phone on a mobile network; on desktop, an emulated computer on a wired connection, as the page About PageSpeed Insights explains.
The big coloured circle at the top of the report is the lab grade, the one people call the PageSpeed score. The report gives four grades in all (performance, accessibility, best practices and SEO) and this guide is about the first. A new or little-visited site often has no field data: only the lab grade is shown then.
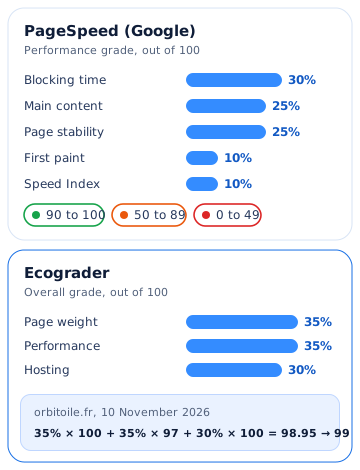
How is the PageSpeed score calculated?
The colour depends on the grade: 90 to 100 is good (green); 50 to 89 needs improvement (orange); 0 to 49 is poor (red). The grade itself combines five measures, each with its own weight. Here is the split that Chrome’s page on how the performance score is calculated gives for Lighthouse 10:
| Measure | What it looks at | Weight in the grade |
|---|---|---|
| Total Blocking Time | How long the page fails to respond to a tap or a click | 30% |
| Largest Contentful Paint | When the main content appears, often the image or heading at the top | 25% |
| Cumulative Layout Shift | Whether the content jumps while loading | 25% |
| First Contentful Paint | When the first text or image appears | 10% |
| Speed Index | How quickly the page fills the screen | 10% |
Blocking time alone is worth 30% of the grade. It measures how long scripts keep the page so busy that it stops responding, and tracking, chat or advertising scripts are often to blame. Together with the largest element and layout shift, three measures make up 80% of the grade. The weighting can change between Lighthouse versions: check it on Chrome’s page.
The three measures Google watches: Core Web Vitals
The grade out of 100 is a lab summary. What Google highlights in its documentation for Search are the Core Web Vitals, three measures taken on real visitors:
| Measure | Question asked | “Good” threshold |
|---|---|---|
| Largest Contentful Paint (LCP) | Does the main content appear quickly? | 2.5 seconds or less |
| Responsiveness (INP) | Does the page respond quickly to a tap or click? | under 200 milliseconds |
| Visual stability (CLS) | Does the page stay steady while you read? | under 0.1 |
PageSpeed reports the assessment as passed when all three measures are good at the 75th percentile, meaning for at least three visits out of four. That percentile is chosen so the page also works for visitors with an old phone or a poor connection. The lab test uses blocking time as its indicator of responsiveness, so lab and field data do not always match.
Why the PageSpeed score changes from one test to the next
Test the same page three times in a row and the grade will not always be identical. Google explains it in its documentation: the measurement depends on local network availability, client hardware and competition between resources, and lab data relies on a single device under fixed network conditions. It can therefore vary even if the page has not changed. In practice:
- run the test three times and keep the middle result;
- compare mobile with mobile and desktop with desktop, because the mobile test simulates a modest phone and often gives a lower grade;
- do not react to a gap of a few points, but to a clear gap or to a measure that falls outside the thresholds in the table above;
- after every change to the page, run the series of tests again before drawing conclusions.
Does the PageSpeed score matter to Google?
In its page on Core Web Vitals and Google Search, Google recommends that site owners aim for good Core Web Vitals to succeed in Search, and explains that page experience aligns with what its core ranking systems seek to reward. That page talks about the three measures in the table above, not about the grade out of 100.
It promises no position either: in its advice, Google reminds us that nobody can guarantee the top position in its results. A good score is a good base for your visitors, not a shortcut to the first page.
Ecograder, the report that adds weight and carbon
Ecograder is a free tool that grades a page out of 100 from three blocks: page weight (35% of the grade), loading performance (35%) and hosting (30%). It also estimates the greenhouse gas emissions of one page load, in grams, and gives a carbon rating from A+ to F. Where PageSpeed looks at the visitor’s experience, Ecograder adds what the page weighs and whether the server runs on renewable energy. A page can be fast and heavy, or light and slow: the two reports complement each other.
Two websites, two reports: orbitoile.fr and Sentinelle Investigations
Here are the readings from the morning of 10 November 2026 on the home page of two websites I built, mobile and desktop combined. The reports are available online: the orbitoile.fr report and the sentinelle-investigations.fr report.
| Measure | orbitoile.fr | sentinelle-investigations.fr |
|---|---|---|
| Ecograder grade | 99/100 | 100/100 |
| Page weight | 100/100, i.e. 196 kB | 100/100, i.e. 287 kB |
| Performance | 97/100 | 99/100 |
| Hosting | 100/100 | 100/100 |
| Main content displayed | 914 ms | 767 ms |
| Speed Index | 2.6 s | 1 s |
| Blocking time | 0 ms | 79 ms |
| Images | 129 kB | 29.4 kB |
| JavaScript | 22 kB | 185 kB |
| Emissions per visit | 0.011 g | 0.029 g |
Why 99 and not 100 for orbitoile.fr? Ecograder’s grade is a weighted average: 35% × 100 + 35% × 97 + 30% × 100 = 98.95, so 99 once rounded. For Sentinelle the calculation gives 99.65, so 100. The point missing from orbitoile.fr therefore comes entirely from performance, and the Speed Index is the only measure there that goes past the report’s limit: 2.6 seconds, when the report recommends under two seconds.
The two pages do not weigh in the same way. orbitoile.fr is heavier in images (129 kB against 29.4 kB), Sentinelle in JavaScript (185 kB against 22 kB, of which 182 kB is the Google Tag Manager script). In both cases the weight grade stays at 100. Ecograder also flags two images on orbitoile.fr to encode more efficiently (32.5 kB and 8.75 kB, about 39 kB of estimated savings): that costs nothing on the weight grade.
Should you aim for 100?
In my view, not at any price. Past 90 the grade is green and a visitor hardly sees the difference between 96 and 100. What matters are the real measures in the Core Web Vitals table: main content in under 2.5 seconds, a response in under 200 milliseconds, a page that does not jump. Winning the last points often means removing something useful, an image, a form, a measuring tool. I do it when the visitor loses nothing, and not otherwise.
On orbitoile.fr, a few rules bear directly on these measures: no font and no script from another site, WebP images with declared dimensions that only load on scroll when they sit below the screen, and light code (22 kB of JavaScript and 3.4 kB of style sheets in the 10 November reading). The same approach gives a cookie-free site. My target remains 95 or more on mobile for the home page and 100 for the other pages. To measure your own site, or mine, the tool on the page Test your website live runs the same Google test. If your grade is low, the guide slow website details the causes and the order of fixes.
Key takeaway
The PageSpeed score sums up five loading measures in one lab grade, and it varies from one test to the next. Google recommends aiming for good Core Web Vitals, measured on real visitors, without guaranteeing any position. Ecograder adds weight, emissions and hosting. Aim for green, check three times, and keep the last point for the day it costs your visitors nothing.